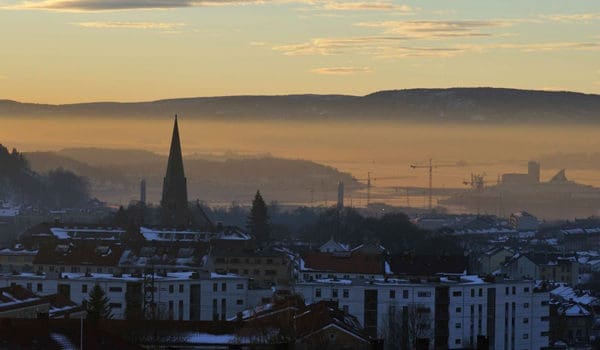
From NILU’s annual report: NILU and MET Norway collaborate on a national project for the development of open source tools for mapping local air quality in Norway. The first phase runs from 2014 to 2016, and by the end of 2016 new tools and information on air quality throughout Norway will be available.
Christine F. Solbakken, Head of Communications, NILU

– The open air quality mapping tool is intended for use by national environmental authorities, researchers and air quality consultants. It is designed to help solve various air quality mapping tasks as prescribed by current legislation on local air quality, explains research director for NILU’s Department for Urban Environment and Industry, Leonor Tarrasón.
Based on a request from the Ministry of Climate and Environment (KLD), the Norwegian Environment Agency, the Norwegian Public Roads Administration, the Norwegian Directorate of Health and the Norwegian Institute of Public Health identified seven main tasks that according to Norwegian legislation require air quality mapping. NILU and MET Norway were entrusted with the task of retrieving the required input data and conducting the first phase of the mapping project, due by the end of 2016.
Research Director Leonor Tarrasón, NILU Photo: Ingunn Trones, NILU
Broad mapping scope
The project will develop maps that can be used to solve the most important tasks required by current law and regulations for local air quality:
- Annual air quality status maps of the geographic extent of air pollution in main cities and agglomerations
- Air quality zone maps in accordance with existing T1520 regulations
- Scenario projection maps of the geographic extent of air pollution in main cities and agglomerations for future years
- Control measures maps to assess the impact of control plans and programmes to reduce air pollution as requested by the regulations in Norwegian cities
- Source allocation maps to establish the contribution of different emission sources to air pollution levels
- Forecast air quality maps with information on air pollution forecasts to inform the public about breaches of alarm thresholds, and support the implementation of short-term measures to prevent air pollution episodes in main city areas
- Health exposure maps for air quality indicating the number of people exposed to harmful levels of air pollution in Norwegian cities and agglomerations
The open source tool should provide results at three levels – for the whole of Norway, for the seven largest cities and for selected towns and agglomerations. In the first phase, the focus is on generating maps showing the annual status, air quality zones, source allocation and health exposure maps. In the next phase, the project will work to establish different interactive tools based on the information gathered in the first phase.
Improved air pollution information
Currently, information on air pollution measurements throughout Norway is available via luftkvalitet.info. Forecasts on air quality are available for nine cities through the Better City Air project. Mapping information as required by legislation is only available sporadically for a few cities.
Tarrasón explains that the main reason why there is so little mapping information about air quality in Norway, is a lack of data on air pollution emissions and meteorological conditions throughout the country. Consistent emission inventories on pollution sources and fine resolution meteorological data over the whole of Norway are necessary to achieve reliable maps.
Thus, NILU and MET have identified that the first priority in the development of the new national mapping calculation tool is to ensure the systematic acquisition of necessary input data for meteorology and emissions, and to establish the procedures that will guarantee regular updates of these data for the foreseeable future.
On track
At the beginning of 2015, the project was on track. The first deliveries included a report with recommendations for data flow and a desirable IT solution. The project has engaged the company NetLife Research to assist in the development of the website for the open mapping tool. NetLife Research will also consider a redesign of luftkvalitet.info, Tarrasón says.
In addition, the scientists have worked systematically to identify emission sources of data for the seven Norwegian cities and 100 villages to be included in the project, and begun the job of creating operational meteorological forecasts for Norway. They also have developed various approaches for mapping pollution conditions in both the cities and the agglomerations.
– We are in close dialogue with our users to ensure further progress, Tarrasón concludes, – and we also have the great advantage of our good relationship and synergies with the forum for Better City Air led by the Norwegian Environment Agency and the Norwegian Public Roads Administration.
