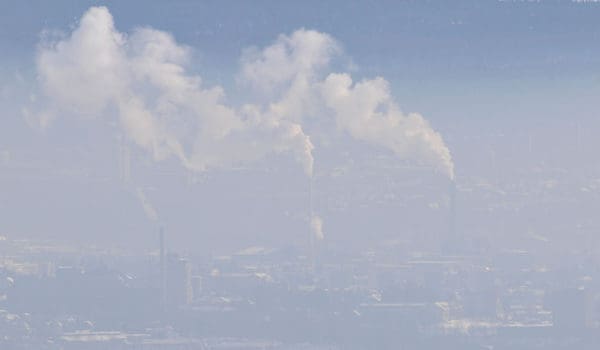
Air pollution has significant impacts on the health of Europeans, particularly in urban areas, according to the new “Air quality in Europe — 2016” report from the European Environment Agency (EEA). Harmful particulate matter causes the premature deaths of ca 467,000 Europeans each year, of which nearly 1600 Norwegians.

Senior scientist Cristina Guerreiro at NILU – Norwegian Institute for Air Research is the main author of the report, which states that the European air quality slowly but surely is getting better. Meanwhile, air pollution remains the biggest environmental health risk in Europe, and in addition to all those who die prematurely, many live with diseases caused by poor air quality.
Fine particulate matter most harmful
The EEA report “Air quality in Europe — 2016” presents an updated overview and analysis of air quality in Europe from 2000 to 2014 based on data from official monitoring stations across Europe, and including more than 400 cities. It shows that in 2014 around 85 % of the urban population in the EU were exposed to fine particulate matter (PM2.5) at levels deemed harmful to health by the World Health Organization (WHO). This particulate matter can cause or aggravate cardiovascular diseases, asthma and lung cancer, and lead to a premature death.
The report also provides new estimates (1) of the health impacts of the most harmful air pollutants based on 2013 data. Exposure to PM2.5 was responsible for about 467 000 premature deaths in 41 European countries in 2013. Within the European Union, premature deaths exceeded 430 000.
– Of these, approximately 1600 are Norwegians, says Cristina Guerreiro. – This is a slight decrease from last years report, when estimates showed 1,700 premature deaths in Norway alone, but it is still too many.
Other types of air pollution also cost lives. The estimated effects of nitrogen dioxide (NO2) and ozone (O3) exposure were respectively ca. 71,000 and 17,000 premature deaths in Europe, ca. 170 and 70 of these in Norway.
Requires fundamental change
– Emission reductions have led to improvements in air quality in Europe, but not enough to avoid unacceptable damage to human health and the environment, said EEA Executive Director Hans Bruyninckx. – We need to tackle the root causes of air pollution, which calls for a fundamental and innovative transformation of our mobility, energy and food systems. This process of change requires action from us all, including public authorities, businesses, citizens and research community.
Karmenu Vella, European Commissioner for the Environment, Maritime Affairs and Fisheries, welcomed the report.
– Today’s EEA report on air quality reminds us that we need to keep this subject high on the political agenda, he said. – The European Commission is doing so, and is committed to securing improvements in air quality. One way we can do that is to help different levels of government work better together. If a lot of air quality blackspots are in towns and cities then it is clear that local and regional governments play a central role in finding solutions. This week I hope that the European Parliament will vote positively on our reduction commitments in the new National Emission Ceilings Directive. This will provide direction for national and local actors.
Air quality improving
The report highlights that air quality has however improved over the years. The annual average PM10 has fallen in 75 % of monitored locations during the period 2000–2014. Similarly, PM2.5 concentrations, on average, have decreased between 2006 and 2014 for all station types (urban, traffic, background sites, etc.). Exposure to PM levels above WHO recommendations have also decreased over the years.
Other key findings
- In 2014, 16 % of the EU-28 urban population was exposed to PM10 levels above the EU daily limit value whereas 8 % was exposed to PM2.5 levels above the EU target value. However, when compared to the stricter WHO Air Quality Guideline values set to protect human health, approximately 50 % and 85 % of city dwellers were exposed to PM10 and PM2.5 concentrations exceeding the WHO’s recommendations.
- NO2 affects the respiratory system directly, but also contributes to the formation of PM and O3. In 2014, 7 % of the urban population in the EU-28 were exposed to NO2 concentrations above the identical WHO and EU standards, with 94% of all exceedances occurring due to traffic.
- PM2.5 emissions from coal and biomass combustion in households and from commercial and institutional buildings have not decreased to any significant degree. To lower emissions from these sectors, it is essential to fully implement measures, such as recent changes to the Eco-design Directive for household stoves, the Medium Combustion Plant Directive, and to provide public guidance on good household burning practices, etc.
- Emissions of ammonia (NH3) from agriculture remain high and contribute especially to sustained PM levels and a number of high-PM episodes in Europe.
- Air pollution continues to damage vegetation and ecosystems. In this context, the most harmful air pollutants are O3, NH3 and NOx.
Revision of the National Emission Ceilings Directive
Following the political agreement reached with the Council in June of this year, the European Parliament formally votes this week on the revised National Emission Ceilings (NEC) Directive. Member States are subsequently also expected to confirm their agreement of the revised directive before the end of 2016. The legislative proposal will establish new national emission reduction commitments applicable from 2020 and 2030 for SO2, NOx, NMVOC, NH3, and PM2.5, which will help Member States in their efforts to improve air quality.
(1) A number of variables, including population density and exposure, total mortality figures and demographic changes such as ageing are taken into account when calculating these estimates. They can vary from year to year.
